
Single National Disability Rating: Peripheral Nervous System | Althox
The assessment of permanent impairment is a critical component in disability ratings, particularly when it involves the intricate structures of the peripheral nervous system. In Colombia, Decree 917 of 1999 established the "Manual Single National Disability Rating," providing a standardized framework for evaluating various types of impairments. This comprehensive guide delves into Chapter II, Section 2, focusing specifically on the peripheral nervous system, outlining the criteria and methodologies used to determine the degree of deficiency resulting from spinal nerve alterations. Understanding these guidelines is essential for medical professionals, legal practitioners, and individuals seeking disability benefits, ensuring a fair and consistent evaluation process.
The complexity of the peripheral nervous system, with its vast network of nerves extending from the brain and spinal cord to the rest of the body, necessitates a meticulous approach to impairment assessment. Injuries or diseases affecting these nerves can lead to a wide spectrum of symptoms, from debilitating pain and sensory loss to significant muscle weakness and motor dysfunction. The Decree aims to translate these subjective and objective findings into a quantifiable percentage of impairment, which then informs the overall disability rating of an individual.
Table of Contents
- General Principles of Assessment for Peripheral Nervous System Impairment
- Pain Assessment in Peripheral Nerve Disorders
- Loss of Muscle Strength and its Impact on Impairment
- Sensory and Motor Disorders: Detailed Evaluation
- Role of Diagnostic Tests in Confirming Nerve Involvement
- The Spinal Nerves: Plexus and Root Injuries
- Brachial Plexus and Upper Trunk Deficiencies
- Lumbosacral Plexus: Lower Extremity and Pelvic Impact
- Spinal Nerve Roots: Specific Deficiencies
- Specific Spinal Nerve Impairment: Head, Neck, and Diaphragm
- Specific Spinal Nerve Impairment: Upper Extremity
- Carpal Tunnel Syndrome Impairment Classification
- Conversion of Finger Deficiency to Hand and Upper Limb Impairment
- Conversion of Upper Limb Deficiency to Global Impairment
- Specific Spinal Nerve Impairment: Lower Extremity
- Conversion of Lower Limb Deficiency to Global Impairment
- Thoracic Root Deficiencies: Unilateral and Bilateral
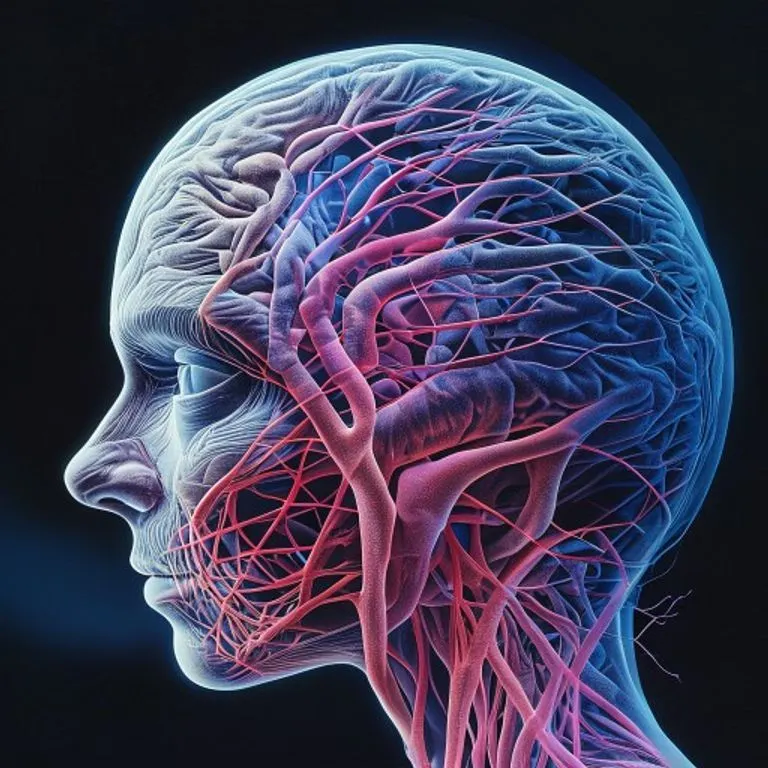
A detailed digital illustration showcasing the complex network of peripheral nerves originating from the spinal cord, crucial for understanding disability assessment.
General Principles of Assessment for Peripheral Nervous System Impairment
The guidelines for assessing permanent impairment resulting from peripheral spinal nerve alterations are meticulously defined within Decree 917 of 1999. The core principle emphasizes that any assessment must be grounded in a comprehensive neurological examination. This examination serves as the foundation for determining the degree of impairment across several key dimensions, ensuring a holistic view of the individual's condition. The objective is to quantify the functional limitations imposed by nerve damage, moving beyond subjective complaints to measurable deficits.
A thorough neurological assessment typically includes evaluating sensory function, motor strength, reflexes, and coordination. Advanced diagnostic tools may also be employed to provide objective evidence of nerve damage. The Decree highlights that the deficiency assessment must consider specific aspects such as pain, loss of muscle strength, and various sensory and motor disorders. Each of these components contributes to the overall picture of impairment and is assigned a specific weight in the final calculation.
Pain Assessment in Peripheral Nerve Disorders
Pain, though a subjective experience, is a significant factor in peripheral nerve disorders and is given careful consideration in the disability rating process. The Decree acknowledges pain as an individual and immeasurable sensation of agony, discomfort, and anxiety that varies among individuals. To evaluate pain associated with spinal peripheral nerve disorders, several factors must be taken into account, moving beyond a simple report of pain to understand its impact and characteristics.
- The extent to which pain interferes with the performance of the individual's daily activities. This includes work, self-care, and social interactions.
- The distribution of pain along the involved dermatome. This helps to localize the nerve damage and confirm its peripheral origin.
- The characteristics of the pain that suggest peripheral neuropathy, and its association with other symptoms or signs of compromised nerve roots.
Nerve pain in the extremities, often described as intense, steady, and variable, is also known as causalgia. This type of pain can become so extreme that it completely disables an individual. It is frequently associated with peripheral neuropathy, particularly involving the median, sciatic, and tibial nerves. When causalgia persists despite appropriate treatment, it can lead to a 100% loss of function for the assessed nerve within the affected limb. Furthermore, if reflex sympathetic dystrophy is associated with causalgia, the same rigorous criteria apply, emphasizing the severe impact of chronic neuropathic pain on functional capacity.
Loss of Muscle Strength and its Impact on Impairment
The assessment of muscle strength loss is a cornerstone in evaluating peripheral nerve impairment. Muscle tests are instrumental in identifying specific nerve injuries and quantifying the extent of muscle weakness, which directly correlates with functional limitations. These tests typically measure the strength, duration, and repetition of muscle contraction. The Decree specifies a structured approach to quantifying this loss, focusing on non-simulated strength measured against gravity and resistance.
The following table, adapted from the Decree, illustrates how impaired range of motion and muscle strength contribute to the percentage of body impairment. This standardized table ensures consistency in evaluating motor deficits. It is crucial to differentiate between strength loss due to pain and actual motor impairment, as these may be assessed separately using corresponding tables to avoid over- or under-estimation of the total deficiency.
| Impaired Range of Motion of the Body | Deficiency (%) |
|---|---|
| Full against gravity and strong resistance | 0 |
| Against slight resistance | 7.5 |
| Only against gravity | 19 |
| With gravity eliminated | 33 |
| Traces of mobility | 45 |
| Zero mobility | 50 |
This table provides a clear scale for quantifying muscle strength deficits, ranging from no impairment to complete immobility. The distinction between strength loss due to pain and actual motor impairment is crucial for accurate assessment. For instance, a patient might exhibit reduced strength due to severe pain upon movement, rather than a direct neurological deficit in muscle innervation. Such cases require careful clinical judgment and may involve separate evaluations for pain and motor function, using specific tables designed for each component.

A medical textbook and tools symbolize the meticulous examination required for disability assessment in neurological cases.
Sensory and Motor Disorders: Detailed Evaluation
Beyond pain and muscle strength, the Decree mandates a detailed assessment of both sensory and motor disorders, recognizing their profound impact on an individual's functional capacity. These disorders can manifest in various ways, affecting perception, movement control, and overall bodily awareness. A comprehensive evaluation requires a nuanced understanding of neurological pathways and their potential disruptions.
For sensory disorders, the assessment must consider:
- Pain and Dysesthesias: Abnormal, unpleasant sensations, often spontaneous or evoked by non-noxious stimuli.
- Changes in Stereognosis: Impairment in recognizing the measures, shape, and quality of objects by touch.
- Changes in Position Sense and Two-Point Discrimination: Deficits in proprioception (awareness of body position in space) and the ability to distinguish two separate points of contact.
- Paresthesias of Cerebral Origin: Abnormal sensations like tingling, prickling, or numbness that originate from central nervous system dysfunction, but can be relevant in differential diagnosis.
- More Complex Tests: Disturbances in body image or other subtle perceptual changes that might be revealed through advanced testing.
Motor disorders encompass a broader range of conditions that affect movement. While hemiparesis (weakness on one side of the body) and hemiplegia (paralysis on one side) are clearly limiting, other less obvious symptoms also contribute significantly to impairment. These include:
- Involuntary Movements: Tremors, athetosis (slow, writhing movements), chorea (brief, irregular movements), or hemiballism (large, flinging movements of one limb).
- Changes in Tone and Posture: Abnormal muscle tone (e.g., spasticity or rigidity) and difficulties maintaining proper posture.
- Akinesia and Dyskinesia: Various forms of reduced or impaired movement, such as those seen in Parkinson's disease, where movement initiation and execution are severely affected.
- Associated and Cooperative Movement Deficiencies: Difficulties in performing coordinated, multi-joint movements, including complex alterations of manual dexterity and gait, such as ataxias.
Role of Diagnostic Tests in Confirming Nerve Involvement
Objective diagnostic tests play a crucial role in confirming nerve involvement and quantifying the extent of damage, complementing the clinical examination. These tests provide measurable data that can corroborate subjective symptoms and aid in precise impairment ratings. The Decree specifically highlights electrodiagnostic studies as vital tools in this process.
- Electromyography (EMG): Measures the electrical activity of muscles in response to nerve stimulation, revealing nerve damage or muscle disease.
- Nerve Conduction Studies (NCS): Measure how fast electrical signals travel through a nerve, identifying nerve damage and its severity.
- Evoked Potentials: Measure the electrical activity of the brain in response to sensory stimulation, assessing the integrity of sensory pathways.
It is imperative that these specialized tests are performed only in specialized centers by professionals with proven expertise and technical capacity. The accuracy and reliability of these tests directly influence the validity of the impairment assessment, underscoring the need for high standards in their execution and interpretation. The results from these tests provide objective evidence of nerve damage, which is vital for legal and medical purposes in disability claims.
The Spinal Nerves: Plexus and Root Injuries
The assessment of permanent impairment caused by damage to peripheral spinal nerves follows a recommended order, moving from broader nerve structures to more specific ones. This systematic approach ensures that all levels of potential injury are considered, from nerve roots to individual nerves. The primary categories for evaluation include spinal nerve roots, spinal nerve complexes (plexuses), and specific spinal nerves.
Injuries or diseases affecting the spinal nerve plexuses require a unique assessment methodology, as they involve a complex network of nerves rather than a single nerve. The deficiency is determined by evaluating the loss of their varied functions. Nerve plexuses are formed by the anastomosis (interconnection) of nerve roots, creating main nerve trunks. Injuries to these plexuses often lead to easily recognizable and accurate clinical syndromes, making their assessment critical for diagnosis and impairment rating.
- Brachial Plexus and Upper Trunk: Primarily affecting the shoulder and upper extremity.
- Lumbosacral Plexus or Middle/Lower Trunk: Impacting the lower extremity, pelvis, and associated organs.
Brachial Plexus and Upper Trunk Deficiencies
The brachial plexus is a critical network of nerves that supplies the shoulder and upper extremity. It is formed by the anterior divisions of the C5, C6, C7, and C8 cervical roots and the first thoracic root (T1). Damage to this plexus can result in significant functional limitations in the arm, hand, and shoulder. The Decree provides specific guidelines for assessing deficiencies in different parts of the brachial plexus, considering both sensory deficits (pain or discomfort) and loss of strength.
The following table details the deficiency percentages for unilateral brachial plexus injuries. The global deficiency is determined by combining the sensory deficit and loss of strength, with a maximum value specified for each trunk. This ensures that the total impairment does not exceed the recognized limits for that specific nerve segment.
| Brachial Plexus Area | Sensory Deficit (Pain or Discomfort) (%) | Loss of Strength (%) | Top Value Total Loss (%) |
|---|---|---|---|
| Upper Trunk (C-5, C-6) (Duchenne-Erb) | 0 - 15 | 0 - 15 | 0 - 30 |
| Middle Trunk (C-7) | 0 - 7 | 0 - 15.5 | 0 - 23.5 |
| Lower Trunk (C-8, T-1) (Klumpke-Déjerine) | 0 - 1.5 | 0 - 10 | 0 - 11.5 |
NOTE: The sum of the deficiencies caused by the sensory deficit, pain or discomfort, and those of loss of strength, is equivalent to the maximum value of the overall deficit. Therefore, this sum cannot exceed that value.
Understanding the specific clinical syndromes associated with brachial plexus injuries, such as Duchenne-Erb palsy (affecting the upper trunk) and Klumpke-Déjerine palsy (affecting the lower trunk), is crucial for accurate assessment. These conditions present with distinct patterns of weakness and sensory loss, which must be carefully identified during the neurological examination to apply the correct deficiency percentages from the table. The note emphasizes a critical rule: the combined percentage from sensory and motor deficits cannot exceed the specified "Top Value Total Loss" for that plexus segment, preventing over-calculation of impairment.
Lumbosacral Plexus: Lower Extremity and Pelvic Impact
The lumbosacral plexus is another major nerve complex, forming the principal nerves of the lower extremity and pelvis. Alterations in this plexus can have far-reaching consequences, affecting not only the lower limbs but also vital functions related to the intestine, bladder, and sexual organs, as well as trunk stability. Given its extensive innervation, injuries to the lumbosacral plexus can lead to complex and severe disability. The assessment criteria mirror those for the brachial plexus, focusing on sensory deficits and loss of strength.
The following table outlines the deficiencies for unilateral lumbosacral plexus injuries. The global deficiency combines sensory deficits (pain or discomfort) and loss of strength, with a defined maximum total loss. This comprehensive approach ensures that the multifaceted impact of lumbosacral plexus damage is adequately captured in the impairment rating.
| Lumbosacral Plexus Area | Sensory Deficit (Pain or Discomfort) (%) | Loss of Strength (%) | Top Value Total Loss (%) |
|---|---|---|---|
| Lumbosacral Plexus | 0 - 16 | 0 - 19 | 0 - 35 |
NOTE: The sum of the deficiencies caused by the sensory deficit, pain or discomfort, and loss of strength, is equivalent to the maximum value of the overall deficit. Therefore, this amount cannot exceed that value.
Spinal Nerve Roots: Specific Deficiencies
Individual spinal nerve roots, before forming plexuses, can also be subject to injury or compression, leading to specific patterns of sensory and motor deficits. The Decree provides a detailed table for assessing the deficiency associated with unilateral damage to specific spinal nerve roots. This level of granularity is crucial for accurately attributing impairment to a precise neurological lesion, which can be vital for treatment planning and prognosis.
The following table presents the limb deficiency percentages for various spinal nerve roots, taking into account pain or discomfort, sensory deficit, and loss of strength. These values are then combined to determine the total loss for that specific root. It is important to note that the conversion to global deficiency only occurs when all deficiencies of the studied limb are combined, and if multiple spinal nerves are affected, their values must be weighted according to the overall deficit table.
| Nerve Root | Pain or Discomfort, Sensory Deficit (%) | Loss of Strength (%) | Total Loss (%) |
|---|---|---|---|
| C-5 | 0 - 5 | 0 - 12 | 0 - 17.0 |
| C-6 | 0 - 5 | 0 - 15 | 0 - 20.0 |
| C-7 | 0 - 15 | 0 - 4 | 0 - 18.5 |
| C-8 | 0 - 4 | 0 - 20 | 0 - 24.0 |
| T-1 | 0 - 5 | 0 - 7 | 0 - 12.0 |
| L-3 | 0 - 5 | 0 - 7 | 0 - 12.0 |
| L-4 | 0 - 4 | 0 - 14 | 0 - 18.5 |
| L-5 | 0 - 4 | 0 - 16 | 0 - 20.0 |
| S-1 | 0 - 5 | 0 - 7 | 0 - 12.0 |
The conversion to global deficiency must be made only when all the deficiencies of the limb studied are combined. Where there are more committed spinal nerves, the values of limb deficiencies must first be combined and weighted according to the table of overall deficit.
Abstract representation of neurological pain, illustrating its complex and often debilitating nature.
Specific Spinal Nerve Impairment: Head, Neck, and Diaphragm
Beyond the major plexuses and nerve roots, specific individual spinal nerves can also be affected, leading to localized impairments. The Decree provides specific guidelines for assessing these isolated nerve injuries, particularly those impacting the head, neck, and diaphragm. These nerves, though smaller, play crucial roles in sensory perception, motor control, and vital functions like breathing.
The following table details the impairment percentages for specific unilateral spinal nerves affecting the head and neck. It considers both sensory deficits (pain or discomfort) and loss of strength to determine the total global deficiency. This granular assessment allows for precise evaluation of localized nerve damage.
| Nerve | Sensory Deficit (Pain or Discomfort) (%) | Loss of Strength (%) | Total Loss (%) |
|---|---|---|---|
| Greater Occipital | 0 - 2.5 | 0 | 0 - 2.5 |
| Lesser Occipital | 0 - 1.5 | 0 | 0 - 1.5 |
| Great Auricular | 0 - 1.5 | 0 | 0 - 1.5 |
| Accessory Nerve (Spinal Section) | 0 | 0 - 5 | 0 - 5.0 |
A unilateral disorder of the phrenic nerve, which controls the diaphragm, would result in a minimum deficiency, typically 10%, because the person can often compensate and continue with daily activities. However, a bilateral phrenic complication could lead to a significant reduction in respiratory function, necessitating evaluation according to the criteria outlined in the Chapter on the respiratory system. This highlights the interconnectedness of different bodily systems in disability assessment, where a single nerve injury can have widespread implications.
Specific Spinal Nerve Impairment: Upper Extremity
The upper extremity is innervated by a multitude of specific spinal nerves, each responsible for distinct sensory and motor functions of the arm, forearm, and hand. Injuries to these individual nerves can lead to highly localized deficits, impacting dexterity, strength, and sensation. The Decree provides a detailed breakdown of impairment percentages for unilateral damage to these specific nerves, allowing for a precise evaluation of their functional loss.
The following extensive table outlines the limb deficiency percentages for various specific nerves of the upper extremity. It meticulously considers both sensory deficits (pain or discomfort) and loss of strength, providing a total loss percentage for each nerve. This detailed approach is crucial for capturing the nuances of nerve injuries in the upper limb, which are often complex due to the intricate movements and sensory perceptions involved.
| Nerves | Sensory Deficit (Pain or Discomfort) (%) | Loss of Strength (%) | Total Loss (%) |
|---|---|---|---|
| Anterior Thoracic | 0 | 0 - 5 | 0 - 5 |
| Axillary (Circumflex) | 0 - 5 | 0 - 33 | 0 - 38 |
| Dorsal Scapular | 0 | 0 - 5 | 0 - 5 |
| Long Thoracic | 0 | 0 - 15 | 0 - 15 |
| First Brachial Cutaneous (Medial) | 0 - 5 | 0 | 0 - 5 |
| Medial Brachial Cutaneous | 0 - 5 | 0 | 0 - 5 |
| Median (Forearm above the average) | 0 - 31 | 0 - 42 | 0 - 73 |
| Median (Forearm below the average) | 33 | 0 - 28 | 0 - 61 |
| Radial Side Branch of Thumb | 0 - 4 | 0 | 0 - 4 |
| Ulnar Side Branch of Thumb | 0 - 8 | 0 | 0 - 8 |
| Radial Side Branch of Index Finger | 0 | 0 - 8 | 0 - 8 |
| Ulnar Side Branch of Index Finger | 0 - 3 | 0 - 3 | 0 |
| Radial Side Branch of Middle Finger | 0 - 7 | 0 - 7 | 0 |
| Ulnar Side Branch of Middle Finger | 0 - 2 | 0 - 2 | 0 |
| Radial Side Branch of Ring Finger | 0 | 0 - 3 | 0 - 3 |
| Musculocutaneous | 0 - 5 | 0 - 29 | 0 - 24 |
| Radial (Spinal Muscle) (Upper arm with loss of triceps), wrist position | 0 - 5 | 0 - 52 | 0 - 57 |
| Radial - Spinal Muscle Functional Position | 0 - 38 | 0 - 43 | 0 - 5 |
| Upper and Lower Subscapular | 0 | 0 - 5 | 0 - 5 |
| Suprascapular | 0 - 5 | 0 - 14 | 0 - 19 |
| Thoracodorsal - Subscapularis | 0 | 0 - 10 | 0 - 10 |
| Ulnar - Above the Forearm (Medial) | 0 - 7 | 0 - 26 | 0 - 33 |
| Ulnar - Below the Arm (Medial) | 0 - 9 | 0 - 24 | 0 - 33 |
| Ulnar Side Branch of Ring Finger | 0 - 2 | 0 | 0 - 2 |
| Radial Side Branch of Little Finger | 0 - 2 | 0 | 0 - 2 |
| Ulnar Side Branch of Little Finger | 0 - 4 | 0 - 4 | 0 |
NOTE: Refer to Table No. 2.9 to convert the upper extremity deficiency into overall deficit, only after combining all the deficiencies of the upper limb studied.
Carpal Tunnel Syndrome Impairment Classification
Carpal Tunnel Syndrome (CTS) is a common peripheral neuropathy affecting the median nerve in the wrist, leading to pain, numbness, and weakness in the hand. The Decree provides a specific classification for impairment due to CTS, recognizing its distinct clinical presentation and impact on hand function. This classification helps standardize the assessment of CTS, ensuring that individuals with this condition receive appropriate disability ratings based on the severity of their symptoms and objective findings.
The following table categorizes Carpal Tunnel Syndrome into three classes based on the severity of sensory and motor involvement. Each class is assigned a specific deficiency percentage for the hand, upper limb, and global deficit, reflecting the progressive impact of the condition. This structured approach allows for a clear and consistent evaluation of CTS-related impairment.
| Class | Description Criteria | Hand Deficiency (%) | Upper Limb Deficiency (%) | Global Deficit (%) |
|---|---|---|---|---|
| I | Light: There is a sensitivity. | 5.0 | 5.0 | 3.0 |
| II | Moderate: There is motor involvement and sensitivity. | 10.0 | 9.0 | 5.0 |
| III | Severe: There is motor impairment, sensitivity and denervation. | 14.0 | 15.0 | 8.0 |
Conversion of Finger Deficiency to Hand and Upper Limb Impairment
The functionality of the hand is heavily reliant on the integrity of its individual fingers. Injuries or nerve damage affecting fingers can significantly impair overall hand and upper limb function. To accurately reflect this, the Decree provides conversion tables that translate specific finger deficiencies into broader hand and upper extremity impairment percentages. This systematic conversion ensures that localized deficits are appropriately scaled within the overall disability assessment.
The following table illustrates how deficiencies in individual fingers (thumb, index, middle, ring, and little finger) are converted into percentages of hand and upper extremity impairment. This detailed conversion is essential for cases where nerve damage predominantly affects specific digits, providing a standardized method to quantify the broader functional loss. The table accounts for the varying importance of each finger in overall hand function, with the thumb typically having a higher impact.
| Thumb Deficiency (%) | Hand Used (%) | Upper Extremity (%) | Index Finger Deficiency (%) | Hand Used (%) | Upper Extremity (%) |
|---|---|---|---|---|---|
| 0 – 1 | 0 | 0 | 0 – 1 | 0 | 0 |
| 2 - 3 | 1 | 1 | 2 - 5 | 1 | 1 |
| 4 - 6 | 2 | 2 | 6 - 9 | 2 | 2 |
| 7 - 8 | 3 | 3 | 10 - 13 | 3 | 3 |
| 9 – 11 | 4 | 4 | 14 – 17 | 4 | 4 |
| 12 – 13 | 5 | 5 | 18 – 21 | 5 | 5 |
| 14 – 16 | 6 | 5 | 22 – 25 | 6 | 5 |
| 17 – 18 | 7 | 6 | 26 – 29 | 7 | 6 |
| 19 – 21 | 8 | 7 | 30 – 33 | 8 | 7 |
| 22 – 23 | 9 | 8 | 34 – 37 | 9 | 8 |
| 24 - 26 | 10 | 9 | 38 - 41 | 10 | 9 |
| 27 – 28 | 11 | 10 | 42 – 45 | 11 | 10 |
| 29 - 31 | 12 | 11 | 46 – 49 | 12 | 11 |
| Middle Finger Deficiency (%) | Hand Used (%) | Upper Extremity (%) | Ring Finger Deficiency (%) | Hand Used (%) | Upper Extremity (%) |
|---|---|---|---|---|---|
| 0 - 2 | 0 | 0 | 0 – 4 | 0 | 0 |
| 3 - 7 | 1 | 1 | 5 – 14 | 1 | 1 |
| 8 - 12 | 2 | 2 | 15 – 24 | 2 | 2 |
| 13 – 17 | 3 | 3 | 25 – 34 | 3 | 3 |
| 18 – 22 | 4 | 4 | 35 – 44 | 4 | 4 |
| 23 – 27 | 5 | 5 | 45 – 54 | 5 | 5 |
| 28 -32 | 6 | 5 | Little Finger | ||
| 33 - 37 | 7 | 6 | 0 – 9 | 0 | 0 |
| 38 – 42 | 8 | 7 | 10 – 29 | 1 | 1 |
| 43 – 47 | 9 | 8 | 30 – 49 | 2 | 2 |
| 48 - 52 | 10 | 9 | 50 – 69 | 3 | 3 |
| 70 – 89 | 4 | 4 |
Conversion of Upper Limb Deficiency to Global Impairment
Once the individual deficiencies of the upper limb (including specific nerve injuries and finger impairments) have been calculated and combined, the next step in the disability assessment process is to convert this upper limb deficiency into a global impairment percentage for the person. This conversion is crucial for determining the overall impact of the injury on the individual's life and their capacity to perform various activities. The Decree provides a specific table for this conversion, ensuring a standardized approach.
The following table serves as a conversion tool, translating the percentage of upper limb deficiency into a corresponding percentage of global impairment for the individual. It is important to note that these percentages are expressed unilaterally. If there is bilateral involvement, deficiencies for each limb must be determined individually and then combined using a separate combined values table. Furthermore, if the dominant limb is affected, specific criteria outlined in Chapter 1 of the Decree may apply, potentially adjusting the final global impairment percentage.
| Upper Extremity (%) | Global Person (%) | Upper Extremity (%) | Global Person (%) | Upper Extremity (%) | Global Person (%) | Upper Extremity (%) | Global Person (%) | Upper Extremity (%) | Global Person (%) | Upper Extremity (%) | Global Person (%) |
|---|---|---|---|---|---|---|---|---|---|---|---|
| 0 | 0.0 | 20 | 6.0 | 40 | 12.0 | 60 | 18.0 | 80 | 23.0 | 100 | 30.0 |
| 1 | 0.5 | 21 | 6.5 | 41 | 12.5 | 61 | 18.5 | 81 | 24.5 | ||
| 2 | 0.5 | 22 | 6.5 | 42 | 12.5 | 62 | 18.5 | 82 | 24.5 | ||
| 3 | 1.0 | 23 | 7.0 | 43 | 13.0 | 63 | 19.0 | 83 | 25.0 | ||
| 4 | 1.0 | 24 | 7.0 | 44 | 13.0 | 64 | 19.0 | 84 | 25.0 | ||
| 5 | 1.5 | 25 | 7.5 | 45 | 13.5 | 65 | 19.5 | 85 | 25.5 | ||
| 6 | 2.0 | 26 | 8.0 | 46 | 14.0 | 66 | 20.0 | 86 | 26.0 | ||
| 7 | 2.0 | 27 | 8.0 | 47 | 14.0 | 67 | 20.0 | 87 | 26.0 | ||
| 8 | 2.5 | 28 | 8.5 | 48 | 14.5 | 68 | 20.5 | 88 | 26.5 | ||
| 9 | 2.5 | 29 | 8.5 | 49 | 14.5 | 69 | 20.5 | 89 | 26.5 | ||
| 10 | 3.0 | 30 | 9.0 | 50 | 15.0 | 70 | 21.0 | 90 | 27.0 | ||
| 11 | 3.5 | 31 | 9.5 | 51 | 15.5 | 71 | 21.5 | 91 | 27.5 | ||
| 12 | 3.5 | 32 | 9.5 | 52 | 15.5 | 72 | 21.5 | 92 | 27.5 | ||
| 13 | 4.0 | 33 | 10.0 | 53 | 16.0 | 73 | 22.0 | 93 | 28.0 | ||
| 14 | 4.0 | 34 | 10.0 | 54 | 16.0 | 74 | 22.0 | 94 | 28.0 | ||
| 15 | 4.5 | 35 | 10.5 | 55 | 16.5 | 75 | 22.5 | 95 | 28.5 | ||
| 16 | 5.0 | 36 | 11.0 | 56 | 17.0 | 76 | 23.0 | 96 | 29.0 | ||
| 17 | 5.0 | 37 | 11.0 | 57 | 17.0 | 77 | 23.0 | 97 | 29.0 | ||
| 18 | 5.5 | 38 | 11.5 | 58 | 17.5 | 78 | 23.5 | 98 | 29.5 | ||
| 19 | 5.5 | 39 | 11.5 | 59 | 17.5 | 79 | 23.5 | 99 | 29.5 |
The percentages in this table are expressed unilaterally. When there is bilateral engagement, deficiencies will be determined individually for each limb and converted into an overall deficit. Finally, the values are combined using the combined values table. In the case of the dominant limb, the criteria outlined in Chapter 1 must be applied.
Specific Spinal Nerve Impairment: Lower Extremity
Similar to the upper extremity, the lower extremity relies on a complex network of specific spinal nerves for its motor and sensory functions. Injuries to these nerves can lead to significant limitations in mobility, balance, and sensation, profoundly impacting an individual's ability to walk, stand, and perform daily activities. The Decree provides a comprehensive table for assessing unilateral impairment to these specific nerves, ensuring a precise and consistent evaluation of lower limb deficits.
The following table details the limb deficiency percentages for various specific nerves of the lower extremity. It considers both sensory deficits (pain or discomfort) and loss of strength to determine the total loss percentage for each nerve. This detailed approach is essential for accurately quantifying the impact of nerve damage in the lower limb, which is critical for assessing an individual's capacity for ambulation and weight-bearing activities.
| Nerves | Sensory Deficit (Pain or Discomfort) (%) | Loss of Strength (%) | Total Loss (%) |
|---|---|---|---|
| Femoral | 0 - 38 | 0 - 33.2 | 0 - 4.8 |
| Femoral (below the iliac nerve) | 0 - 34 | 0 - 19.2 | 0 - 4.8 |
| Genitofemoral | 0 - 5 | 0 | 0 - 5 |
| Inferior Gluteal | 0 | 0 - 25 | 0 - 25 |
| Lateral Femoral Cutaneous | 0 - 10 | 0 | 0 - 10 |
| Internal Obturator Nerve | 0 | 0 - 10 | 0 - 10 |
| Piriformis Muscle Nerve | 0 | 0 - 10 | 0 - 10 |
| Obturator | 0 | 0 - 10 | 0 - 10 |
| Posterior Thigh Cutaneous | 0 - 5 | 0 | 0 - 5 |
| Superior Gluteal | 0 | 0 - 20 | 0 - 20 |
| Sciatic (nerve supply above the popliteal fossa) | 0 - 20.2 | 0 - 60.8 | 0 - 81 |
| Common Peroneal (Lateral Popliteal External) | 0 - 38 | 0 - 33.2 | 0 - 4.8 |
| Deep Peroneal (above the middle tibia) | 0 | 0 - 25 | 0 - 25 |
| Deep Peroneal (below the middle tibia) | 0 | 0 - 5 | 0 - 5 |
| Superficial Peroneal | 0 - 9.4 | 0 - 2.6 | 0 - 14 |
| Tibial Nerve (Popliteal Medial or Internal) Above knee | 0 | 0 - 45 | 0 - 45 |
| Posterior Tibial (half calf and knee) | 0 - 12.4 | 0 - 20.6 | 0 - 33 |
| Posterior Tibial (below half calf) | 0 - 14 | 0 - 14 | 0 - 28 |
| Lateral Plantar Branch | 0 - 5 | 0 - 5 | 0 - 10 |
| Medial Plantar Branch | 0 - 5 | 0 - 5 | 0 - 10 |
| Sural | 0 - 5 | 0 | 0 - 5 |
Notes:
1. View Table No. 2.11 to convert the lower limb deficiency into global impairment of the person.
2. The overall deficit conversion from partial deficiency is only done when all the deficiencies affecting the lower limb have been studied in combination.
Conversion of Lower Limb Deficiency to Global Impairment
After assessing the individual nerve deficiencies within the lower limb and combining them, the next crucial step is to convert this regional impairment into a global impairment percentage for the entire person. This conversion provides a standardized measure of how the lower limb's functional limitations contribute to the individual's overall disability. The Decree ensures consistency in this process by providing a specific conversion table.
The following table facilitates the conversion of lower limb deficiency percentages into global impairment percentages. These values are expressed unilaterally. As with the upper limb, if bilateral involvement is present, the deficiencies for each limb must be determined separately and then combined using the specific combined values table. This systematic approach ensures that the total impact of lower limb nerve damage on an individual's global functional capacity is accurately reflected in the disability rating.
| Lower Extremity (%) | Global Person (%) | Lower Extremity (%) | Global Person (%) | Lower Extremity (%) | Global Person (%) | Lower Extremity (%) | Global Person (%) | Lower Extremity (%) | Global Person (%) | Lower Extremity (%) | Global Person (%) |
|---|---|---|---|---|---|---|---|---|---|---|---|
| 0 | 0.0 | 20 | 4.0 | 40 | 8.0 | 60 | 12.0 | 80 | 16.0 | 100 | 20.0 |
| 1 | 0.0 | 21 | 4.0 | 41 | 8.0 | 61 | 12.0 | 81 | 16.0 | ||
| 2 | 0.5 | 22 | 4.5 | 42 | 8.5 | 62 | 12.5 | 82 | 16.5 | ||
| 3 | 0.5 | 23 | 4.5 | 43 | 8.5 | 63 | 12.5 | 83 | 16.5 | ||
| 4 | 1.0 | 24 | 5.0 | 44 | 9.0 | 64 | 13.0 | 84 | 17.0 | ||
| 5 | 1.0 | 25 | 5.0 | 45 | 9.0 | 65 | 13.0 | 85 | 17.0 | ||
| 6 | 1.0 | 26 | 5.0 | 46 | 9.0 | 66 | 13.0 | 86 | 17.0 | ||
| 7 | 1.5 | 27 | 5.5 | 47 | 9.5 | 67 | 13.5 | 87 | 17.5 | ||
| 8 | 1.5 | 28 | 5.5 | 48 | 9.5 | 68 | 13.5 | 88 | 17.5 | ||
| 9 | 2.0 | 29 | 6.0 | 49 | 10.0 | 69 | 14.0 | 89 | 18.0 | ||
| 10 | 2.0 | 30 | 6.0 | 50 | 10.0 | 70 | 14.0 | 90 | 18.0 | ||
| 11 | 2.0 | 31 | 6.0 | 51 | 10.0 | 71 | 14.0 | 91 | 18.0 | ||
| 12 | 2.5 | 32 | 6.5 | 52 | 10.5 | 72 | 14.5 | 92 | 18.5 | ||
| 13 | 2.5 | 33 | 6.5 | 53 | 10.5 | 73 | 14.5 | 93 | 18.5 | ||
| 14 | 3.0 | 34 | 7.0 | 54 | 11.0 | 74 | 15.0 | 94 | 19.0 | ||
| 15 | 3.0 | 35 | 7.0 | 55 | 11.0 | 75 | 15.0 | 95 | 19.0 | ||
| 16 | 3.0 | 36 | 7.0 | 56 | 11.0 | 76 | 15.0 | 96 | 19.0 | ||
| 17 | 3.5 | 37 | 7.5 | 57 | 11.5 | 77 | 15.5 | 97 | 19.5 | ||
| 18 | 3.5 | 38 | 7.5 | 58 | 11.5 | 78 | 15.5 | 98 | 19.5 | ||
| 19 | 4.0 | 39 | 8.0 | 59 | 12.0 | 79 | 16.0 | 99 | 20.0 |
Thoracic Root Deficiencies: Unilateral and Bilateral
The thoracic spinal nerve roots, while less commonly associated with significant motor deficits in the limbs compared to cervical or lumbar roots, can still lead to considerable impairment, particularly concerning sensory function and trunk stability. Injuries to these roots can result in neuropathic pain, sensory loss, and sometimes weakness in intercostal muscles or abdominal wall, impacting breathing and core strength. The Decree provides specific guidelines for assessing deficiencies in thoracic roots, distinguishing between unilateral and bilateral involvement.
The following table outlines the global deficiency percentages for both unilateral and bilateral thoracic root injuries. This differentiation is crucial because bilateral damage can have a much more profound impact on an individual's respiratory mechanics and trunk stability than unilateral involvement. The table provides clear ranges for deficiency based on the number of affected roots, ensuring a consistent and accurate assessment of these often-overlooked nerve injuries.
| Number of Thoracic Roots Affected | Global Deficiency Unilateral Thoracic Roots (%) | Global Deficiency Bilateral Thoracic Roots (%) |
|---|---|---|
| Two Thoracic Roots | 0 - 2.4 | 0 - 4.9 |
| Five Thoracic Roots | 2.5 - 7.4 | 5.0 - 13.9 |
| Any of Five or More Thoracic Roots | 7.5 - 17.5 | 14.0 - 29.0 |
The assessment of peripheral nervous system impairment under Decree 917 of 1999 is a complex but meticulously structured process. It requires a thorough understanding of neurological anatomy, clinical presentation, and the specific guidelines provided by the Decree. By systematically evaluating pain, muscle strength, sensory and motor disorders, and utilizing objective diagnostic tests, medical and legal professionals can ensure accurate and fair disability ratings for individuals affected by peripheral spinal nerve alterations. This detailed framework underscores the commitment to a comprehensive and equitable assessment of functional limitations.
Fuente: Contenido híbrido asistido por IAs y supervisión editorial humana.


Comentarios